

Although the city no longer uses its In-Season Commuter Cycling Index, the city does use a different indicator that estimates cycling within central areas over time. According to a 2019 report by the NYC Department of Transportation (DOT), nearly 1.6 million New Yorkers ride a bike, and almost half a million cycling trips are made on a typical day—a figure that increased 55% between 2012 and 2017. In addition, the DOT conducts an annual Citywide Mobility Survey to determine travel behavior, preferences, and attitudes of city residents. They are working with the NYC Department of Health and Mental Hygiene to include questions about cycling in the survey.
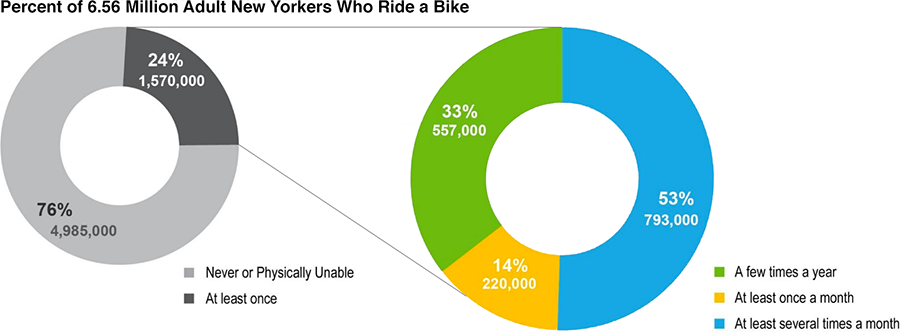
Image credit: NYC Department of Transportation
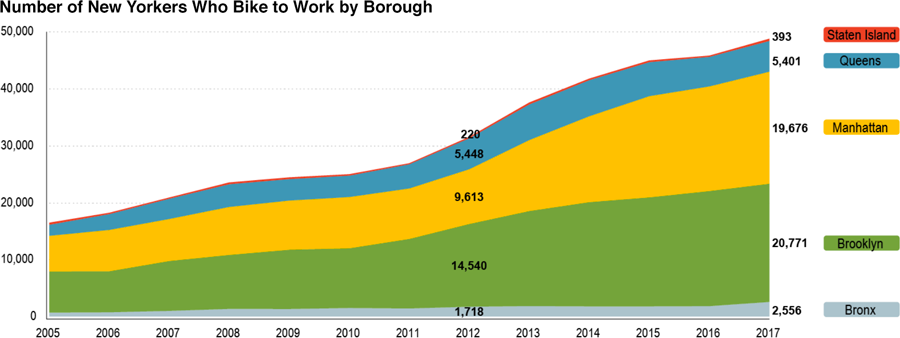
Image credit: NYC Department of Transportation

Transportation
-
 Not Measurable
 The city originally used the In-Season Commuter Cycling Index for this indicator, but has since stopped using it. However, according to the NYC Department of Transportation, cycling increased 55% between 2012 and 2017.
-
As of July 2019, the city had 1,243 bike lane miles.
-
As of March 2020, 660 EV charging stations were in operation in the city.

Waste
-
Incomplete
In 2005, the city sent 3.6 million tons of waste to landfills. In 2019, 3.25 million tons were landfilled, which is equivalent to a 9.8% reduction.
-
In April 2020, the city temporarily suspended organics collection due to the COVID-19 pandemic. Before the suspension, while some neighborhoods had the option to enroll in curbside collection, the programs did not serve all New Yorkers.
-
A study on commercial waste zones was completed in 2016.

Energy & Buildings
-
In 2019, the city generated 10.51 MW of renewable power on city buildings.

Quality of Life
-
According to a three-year rolling average of EPA’s air quality statistics portal, NYC is in 6th place as of 2018.
-
In 2018, the city had achieved a 1.4 mg/m3, or 20% reduction, across city neighborhoods.
-
The city has cleaned up 756 brownfields as of 2019.
-
The city has cleaned up 415 brownfields in low- and moderate-income communities.
-
In 2019, the city partially completed this by developing guidelines for city buildings only.
-
Incomplete
In 2019, 81.5% of New Yorkers were within walking distance to a park.